Scientific inquiry starts with observation. The more one can see, the more one can investigate - Martin Chalfie
Imagine if I was to approach you during your lunch and tell you that there has been an increase in customer raised issues detailing the occurrence of errors whilst processing online transactions, what would be the first question you ask? Which service? What page are they getting the error? Depending on your system and knowledge of said system, you may have completely different questions to ask. Back when monoliths were the standard practise, normally, things were slightly easier to track with regards to the root cause. This was because you only really had to look in one place – a big place, granted – but one place none the less.
Since microservices have become the standard practise nowadays (even in cases when they shouldn’t be), companies have been bending over backwards trying to adopt them. The naive assumption was made that upon adoption, many problems disappear the second you turn off the monolith switch. The experienced among us know this is far from the truth. In fact, in many cases, companies have just traded one problem in for another. Sure, monoliths could be horrible to work with, but if there was a problem, you always knew where to look. Since the widespread adoption of microservices, companies, for the most part, have certainly experienced the benefits that they bring, but have done so at the cost of a more complicated architecture.
The problem domain has gone from “wrestling with the big beast” to “managing these little demons”, and part of being able to effectively manage something is being able to see it. By this, I don’t mean seeing it in a deployment diagram – or even a Kiali dashboard of your Istio service mesh. I’m talking specifically about being able to see your services interact with each other during the request cycle – this is called distributed tracing.
Observability?
There are three main pillars to observability:
- Tracing
- Metrics
- Logging
In this post, I will be touching on distributed tracing, one of the main pillars of observability. Distributed tracing provides you with the insights into the full lifecycle of requests in your system. If a user logged onto your website, depending on the complexity of your system architecture, they may hit a few services along the way. Each request that they make, will be traced through the system. Having a strong observability platform will allow you to gain insights to the details of the trace and even uncover issues with your system that you were never able to see. Where are the performance bottle necks? Was there an error, if so, where did it start from? All of these are questions in which, when answered, allow you to improve your systems user experience.
OpenTracing & OpenCensus vs OpenTelemetry
Upon preparation of the working example for this post, I initially started using OpenTracing. It was at the half-way point of my Java service when I thought to myself, why am I still using OpenTracing? Especially since it’s merged with OpenCensus to become OpenTelemetry? And now you probably ask, what do all of these words mean?
OpenTracing & OpenCensus
OpenTracing – a CNCF project, now an incubating project – was/is a vendor-agnostic standardised API that allowed engineers to instrument traces throughout their code-base. It allowed for the creation of instrumentation libraries that would essentially wrap around application code in order to record and report trace information.
OpenCensus – a Google project – is a set of libraries that allow you to collect application metrics and distributed traces in real-time. Similar to OpenTracing, it required the engineer to instrument the API calls into their code with the additional benefit of capturing metric data.
The problem engineers had with the two options above is deciding which one to use. Should they use OpenTracing for tracing and OpenCensus for metrics? Or should they use OpenCensus for both tracing and metrics? This is where OpenTelemetry came in.
OpenTelemetry
OpenTelemetry (OTEL) was formed by the merging of OpenTracing and OpenCensus. Currently a CNCF sandbox project and its second most active in terms of contributions – Kubernetes being the first –, OTEL since its inception aimed to offer a single set of APIs and libraries that standardise how you collect and transfer telemetry data.
OTEL not only aimed to simplify the choice, but it also allows for cross-platform capability with SDKs being written in several different languages. Its architecture and SDKs allow for companies to develop their own instrumentation libraries and analyse the trace information with supported platforms. We will look at this in a bit more detail during the example below where we use OpenTelemetry to create and collect the telemetry data whilst exporting it to a Jaeger backend to visualise them.
Jaeger
Developed at Uber and now a CNCF graduated project, Jaeger is a distributed tracing platform that was inspired by Dapper and Zipkin. Jaeger allows for the visualisation of request traces through a set of services that exist in a system domain. This functionality is incredibly powerful as it allows engineers to quickly pinpoint exact points of failures in what could be a complex and intricate architecture.
Let’s Get Started
Without talking too much, let’s get into an example. Before I go any further, I feel that I have to make it known that the purpose of this post is to shine a light on the power and capabilities of OpenTelemetry, Jaeger and distributed tracing. If you’ve been reading my blog posts previously you know that I tend to write a step by step walkthrough on what I’m doing. For this post, I will be assuming that you have a good knowledge of Docker and microservice APIs so that if you wanted to run through what I’ve done you could check out the GitHub repository and run it yourself without me walking you through it. So now that the disclaimer is out there, let’s get started.
For the purpose of this post, I have created a basic employee management system that allows for the creation and retrieval of employees and their details. The repository is hosted on GitHub and contains multiple different services and databases that each have their own simple function to perform. The below architecture diagram outlines the different components.
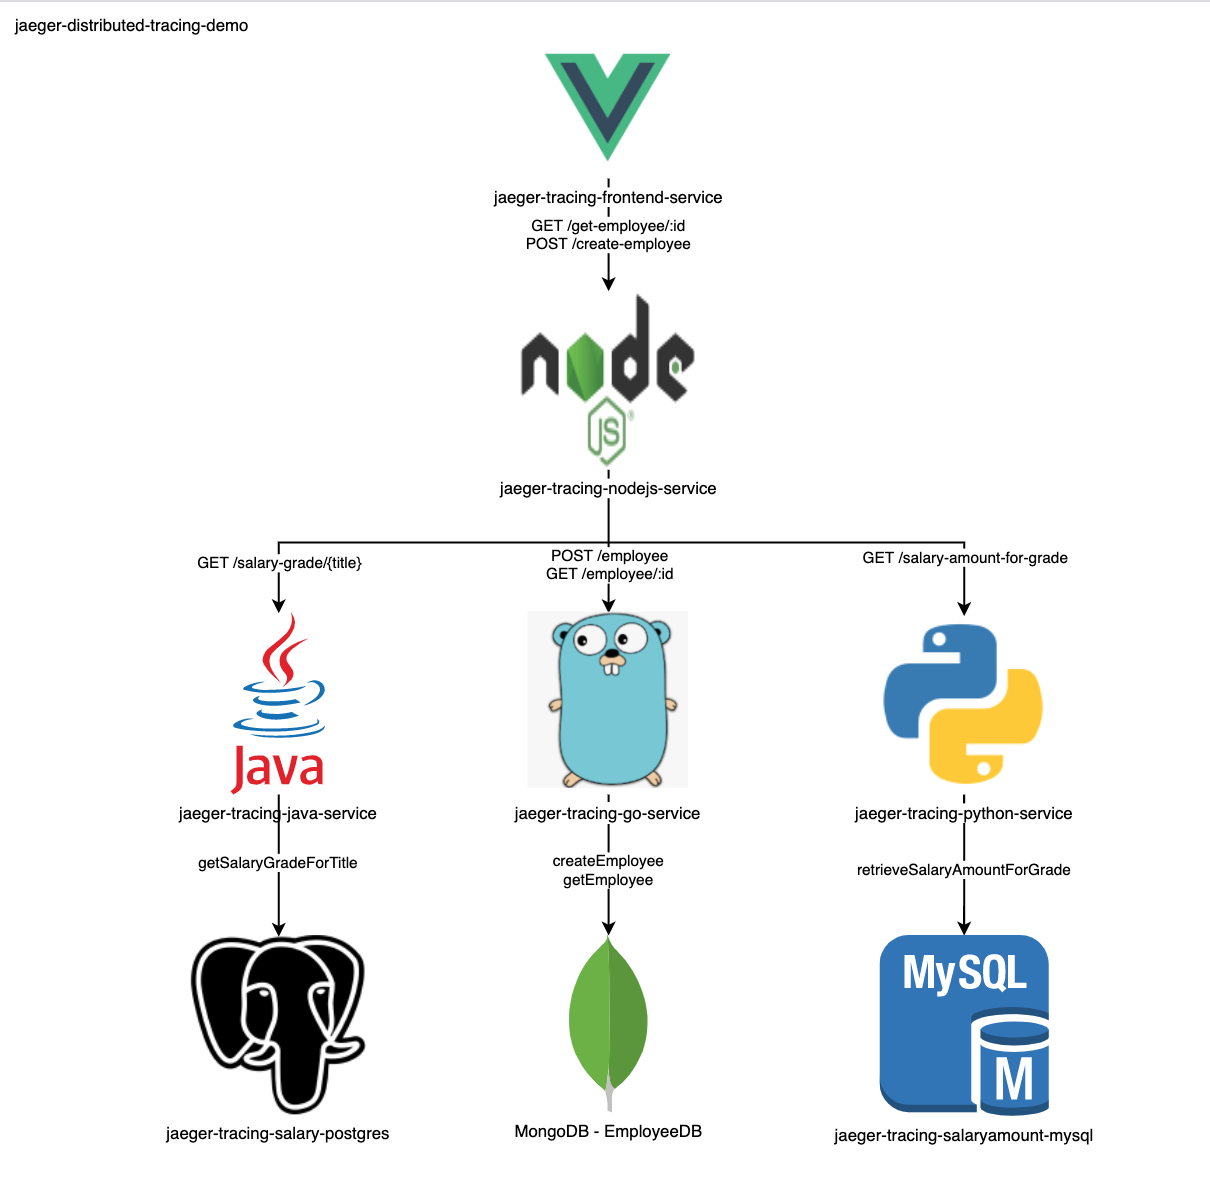
- Front-end service: Simple front-end service written in VueJS
- NodeJS API: Simple NodeJS Express API that serves the data for the front-end and communicates with the three backend services
- Java Backend API: goes to a PostgreSQL database in order to collect the associated salary grade of the employee’s official title
- Go Backend API: writes/retrieves to/from the employee Mongo database
- Python Backend API: retrieves the salary amounts for a specific grade from a MySQL database
The Selection of Languages
Each of the languages that were chosen all have auto-instrumentation libraries. What this means is that I didn’t have to write any code in order for the trace information to be collected and sent to the backend. This is especially great for companies who may not have the necessary expertise or time in order to create a comprehensive tracing framework that is specifically tailored to their requirements and business domain. Due to the fast adoption and progression of OpenTelemetry, there are many auto-instrumentation libraries that aim to do all the manual lifting for the users of their frameworks. An example of this, is that for Java there is an auto-instrumentation .jar file that you can attach as an agent to the JVM inside the container that automatically records the information you need and sends it to the place you want to send it. For NodeJS there are built-in extensions for the Express library so all of the requests in and out from your API endpoints are automatically traced and collected and sent to the analysis tool of your choice. In some languages like Rust or even Golang, the level of auto-instrumentation can be limited depending on its popularity as a language. From my basic observations, the Java and JavaScript instrumentation libraries seem to be the most supported and extended. I did try to make a full example of all of the currently supported languages by OpenTelemetry, but due to most of them requiring more heavy-lifting than I originally planned to do, I thought JavaScript, Java, Golang and Python were enough.
Running the system
To run the stack, I will bring all services up by using the docker-compose file in the jaeger-distributed-tracing-demo parent repository. It has all services and databases as git submodules for easier management and maintenance. If you are running this yourself, you will need to build the java-service just so the Dockerfile can use the JAR file.
Note: if you are running this yourself, the first run will take a bit of time due to the downloading of the base images and the building of the service images.
Once all of the services and databases are up and running, there should be two URLs that should now be available. The employee management front-end, and the jaeger front end.
Creating an Employee
Navigating to localhost:8080 takes us to the employee management service front-end where a few text boxes and buttons exist to allow us to create and get employees.
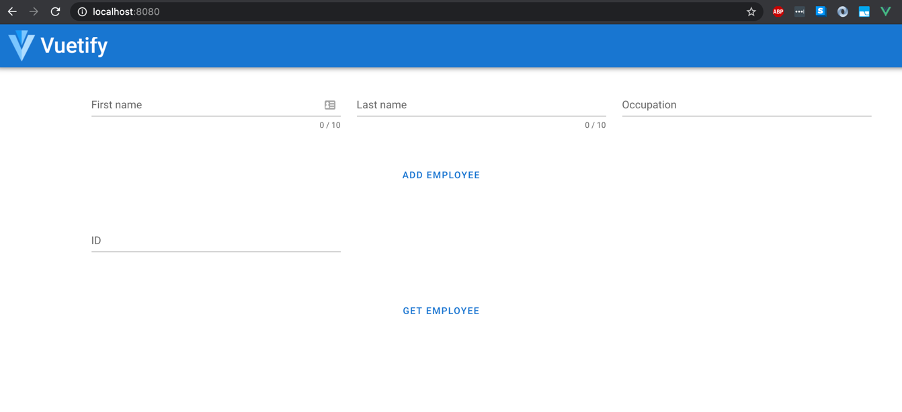
Let’s create an employee called Joe Bloggs and let’s give him the title of Senior Software Engineer.
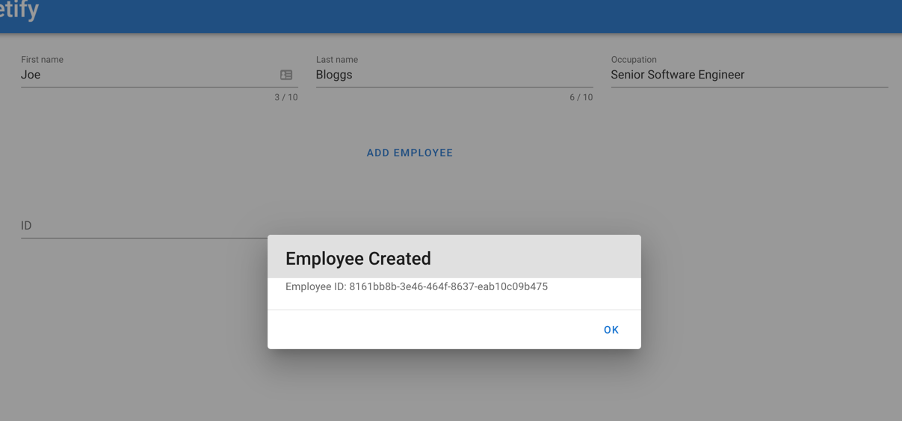
Now, in the background, the front-end service sent a POST /create-employee request to the NodeJS API which has in-turn sent a GET /salary-grade/{title} request to the java-service that gets the salary grade (in this case A3) for the title Senior Software Engineer and returns it to the NodeJS API which subsequently uses it in a GET /salary-amount-for-grade request to the Python service which gets the minimum and maximum salary amounts for the salary grade from the database which in this case is 40000-49999. When the Python API returns both the minimum and maximum salary amounts back to the NodeJS API, it will calculate a random number between the two and then sends all employee details to the go-service via a POST /employee request that inserts all data in the MongoDB employee database.
Paired with the architecture diagram, the above explanation may be somewhat easy to understand. However, the architecture diagram does not illustrate the request flow that was followed exactly. This is where Jaeger comes in.
As part of the OpenTelemetry export functionality, all trace data can be sent to a direct analysis tool like Jaeger or Zipkin or it allows you to send it to a proxy (that could be an OpenTelemetry collector attached as a side-car to the service container) which further exports all data to an analysis tool of choice. Additionally, if you are using OpenTelemetry for metrics, all data can be exported to a metric analysis tool of choice such as Prometheus. Due to the simple local setup I’ve got, I export all data directly to Jaeger using the jaeger-exporter functionality offered by the relevant libraries and SDK. An example of this can be found in the go-service
Enough of the what’s happening in the background, let’s see some request traces.
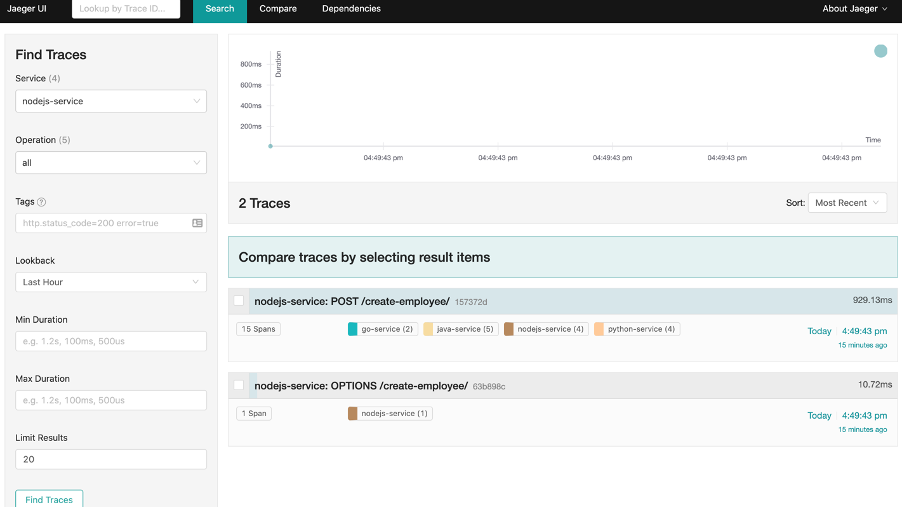
If I navigate to the localhost:16686 URL, I get sent to the Jaeger front-end.
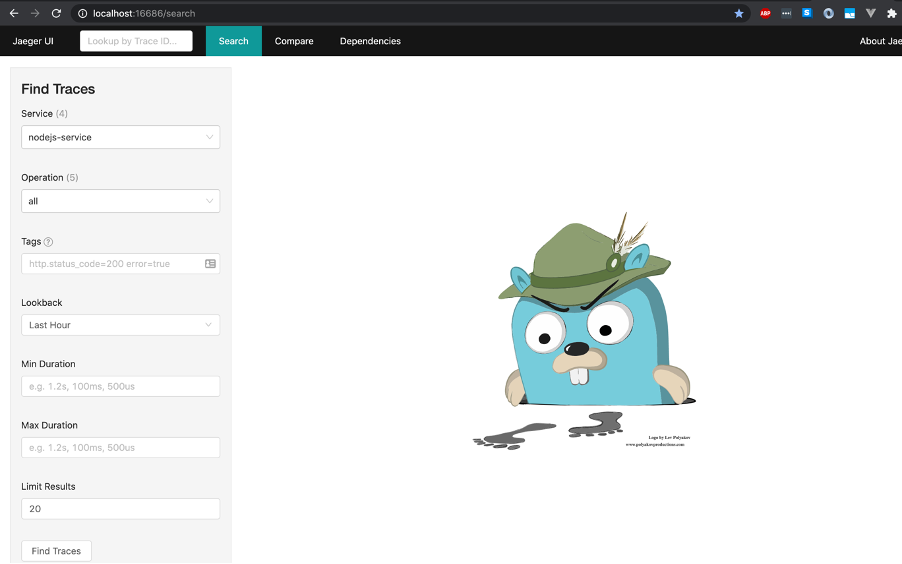
Now as you probably can see, there are some services already populated in the drop down at the top left. If there are traces exported to Jaeger, it will add the service to the list. Now, since it’s already got the nodejs-service already populated, let’s ignore the rest of the options and click Find Traces.
Here, we’re shown two traces - the top one being what we’re are interested in.
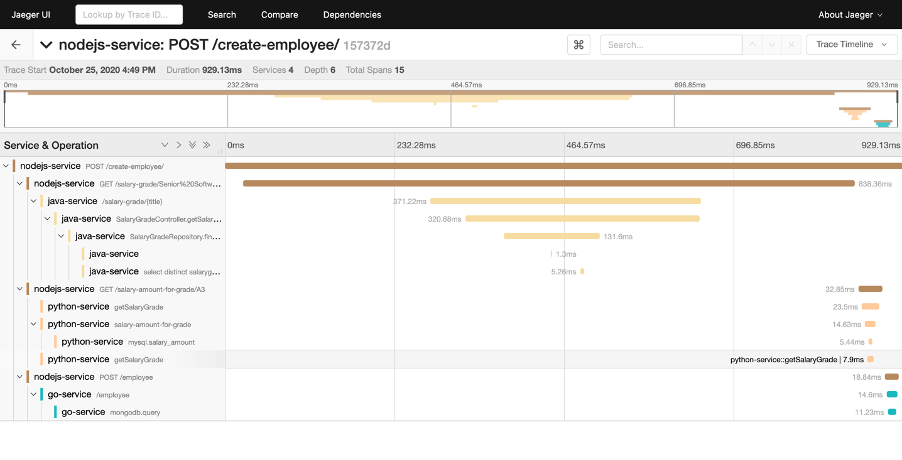
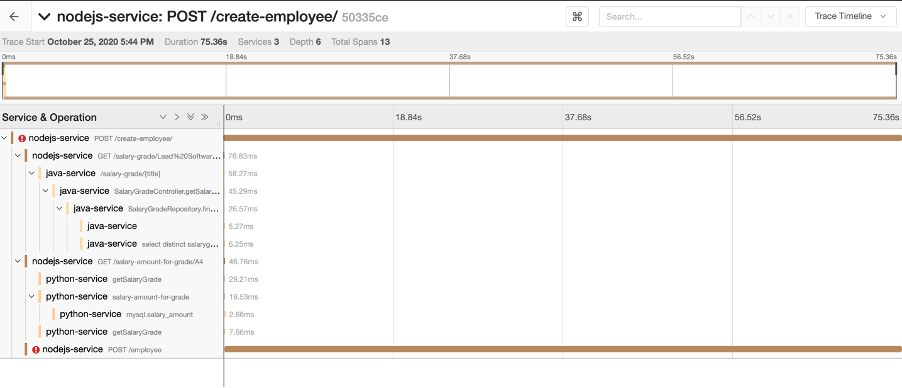
Once clicked, the entire trace is displayed on-screen.
If you are wondering why the front-end service is not on the trace as it was essentially where the trace should have started, the reason for this is because although VueJS is supported by OpenTelemetry via its “web” package in the “opentelemetry-js” repository, currently the JavaScript jaeger-export libraries (I am using it in the NodeJS API service) is not supported in the browser. This means that the VueJS front-end service, although it creates OpenTelemetry data, cannot export it to Jaeger - which is why we cannot see the front-end service in Jaeger.
If I was to use Golang for the front-end there would have been no problems, however, I wanted to learn some VueJS and treated this example system as a means to do exactly that.
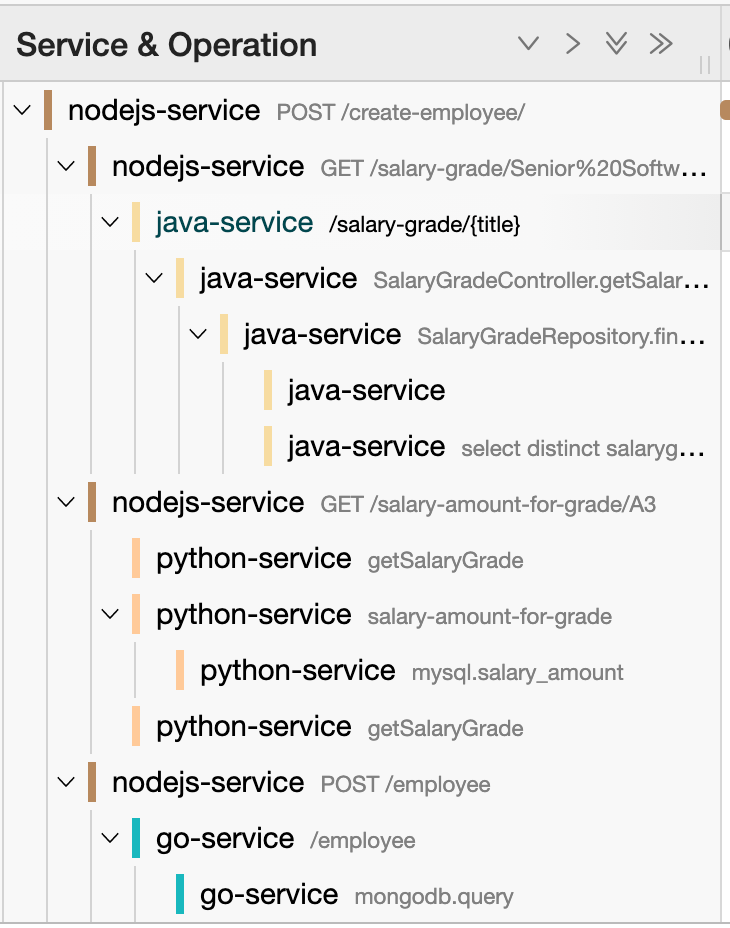
Now, let’s look at the trace, we can see that the request was sent to the NodeJS API and the subsequent calls to the other back-end services are also listed in the Gantt chart. We have a good idea of what requests and which services, took the longest to respond to their caller, additionally, we can see the details of the endpoints that were hit for each service.
Let’s expand the go-service mongodb.query and see what we get.
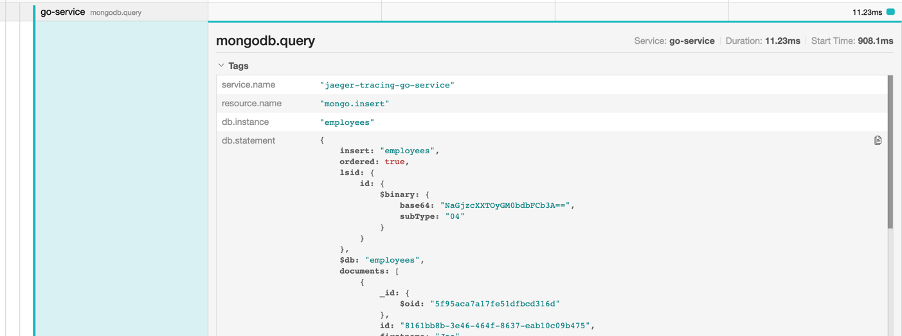
So, not only are we able to see the exact service endpoints that got hit during the request, we are now able to see the exact db.statement that was sent into the MongoDB. This functionality is offered to us out the box by the otelmongo auto-instrumentation library for the Golang implementation of OpenTelemetry. PROTIP: For secure sectors like Government systems, you may want to avoid displaying database queries via any front-end due for the obvious security reasons.
If you have the example system up and running locally, try playing around with the panels in Jaeger, you will also see that the PostgreSQL query that was executed by the java-service is also visible, just like the MySQL query that was executed by the python-service.
Get Employee
Now that we have created the employee Joe, let’s try retrieving him.
On the front-end, when we created our employee, a message was displayed returning the employee ID. When we use it in the get employee section of the page, we will see the following details that were saved to the MongoDB Employee database.
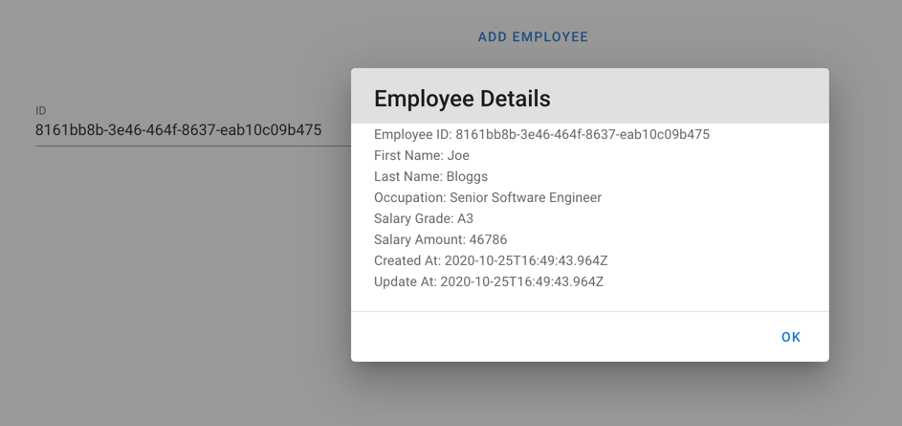
There are some additional bits of information that we can see there that we did not enter into the original employee creation step, these details were what was returned by the java and python services, alongside some additional timestamps that are added to the record by default by MongoDB.
Now let’s look at the trace in Jaeger. If we go to the screen and just click the Jaeger UI button at the top left we get sent back to the home screen. This time, let’s search for the go-service in the drop-down box and click Find Traces.
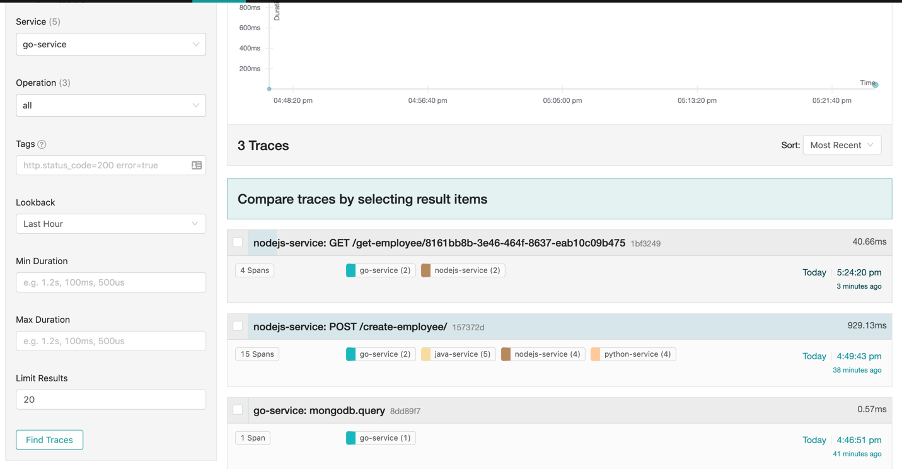
Now, the GET /get-employee query is there as the first entry and it displays the nodejs-service service and the go-service. If you’re wondering why it shows all services, even though we chose a service that is lower down in the request call stack. This is because they are all registered under the same trace-id. In this case, the trace-id is 1bf3249 and if you were to enter that into the search bar at the top left, you would get given this same screen.
How this works more specifically is the trace-id is the id of the overall trace that has the series of events inside it. Each service creates one or more Spans that are each a unit of work in Jaeger. A trace is essentially a collection of Spans (has to have a minimum of one Span). Services can be programmed to create many spans, in our example, all of the auto-instrumentation libraries that we are using essentially create the Spans for us. All of this data gets exported to Jaeger by the exporter libraries in each of our services, and Jaeger essentially puts it all-together for you to visualise.
So, in this case, because the go-service and the nodejs-service are essentially reporting Spans to the same trace, this is why we see both services when click the go-service. We aren’t saying, show me all of the go-service Spans, we are asking Jaeger to show us all traces that the go-service reported spans too.
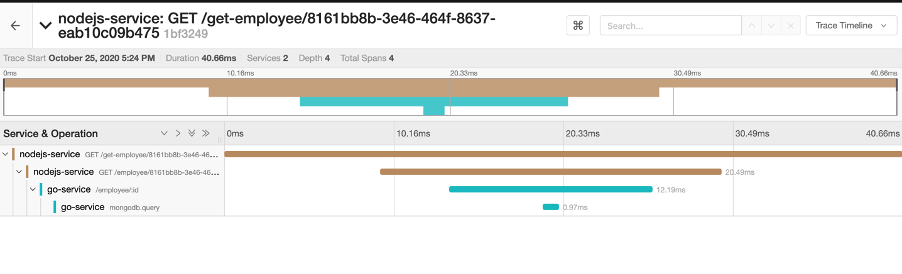
Similar to the create employee trace, we have a Gantt chart displaying the timeline of the request trace. We can see that the request went from the nodejs-service to the go-service and we can also see the endpoints that it hit along the way - as well as the mongodb.query that was executed against the Mongo database.
But What’s the Purpose of all this?
Now, I know that although this looks nice to visualise and is very cool to see. The question “Why do we need all this?” may still be asked. Other than being able to see the request flow through the system, and the timings of them - which could actually give you an idea of where the typical bottle necks are for performance - it actually tells you where the issues started. Thinking back to the first question I asked in this post, imagine you’re on lunch and get given a load of user raised issues, all reporting errors. Where do you start? Is a service down? Is the database broken? Is there an outage? Well, let’s replicate that scenario and see how distributed tracing helps us investigate the issue.
My Request Didn’t Work?
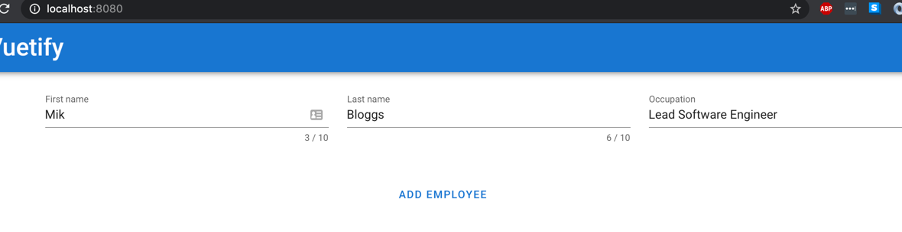
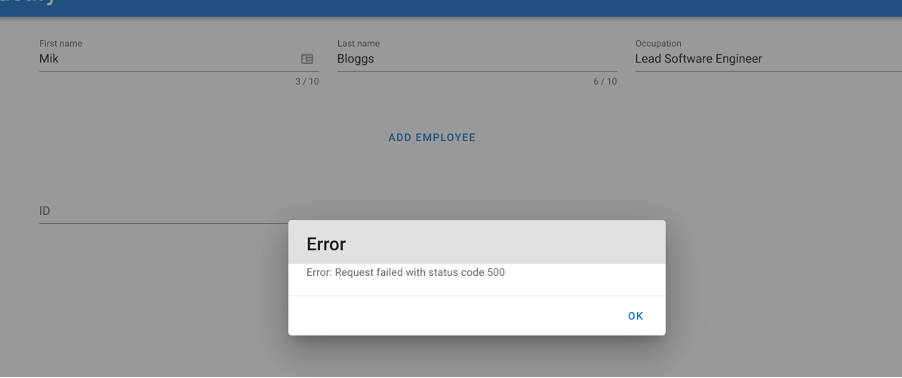
So, let’s say, for example, the go-service was to be “down” due to some service crash. Let’s also assume that there are no recovery protocols in place to restart the service when this happens. What happens if we were to try and create another employee when the go-service is down? To replicate the service being down, I will simply stop the docker container and rerun a create request using the name Mike Bloggs with the title Lead Software Engineer.
So, on the front-end, when I clicked Add Employee nothing happened. As the user, I don’t know why, no error got returned through the screen. So, my natural instinct is to click it again. And again. And again. But still nothing.
Eventually, I get an error back.
Now sure, it took too long because of timeouts, an easy fix, just add it to the backlog. However, let’s say one of your services didn’t have retry logic or timeout handling. You would experience the same thing. The chances are, a user wouldn’t hang around long enough to wait for the error to be returned. They would either leave the website and never return or they may be kind enough to file a bug to let you know about the problem.
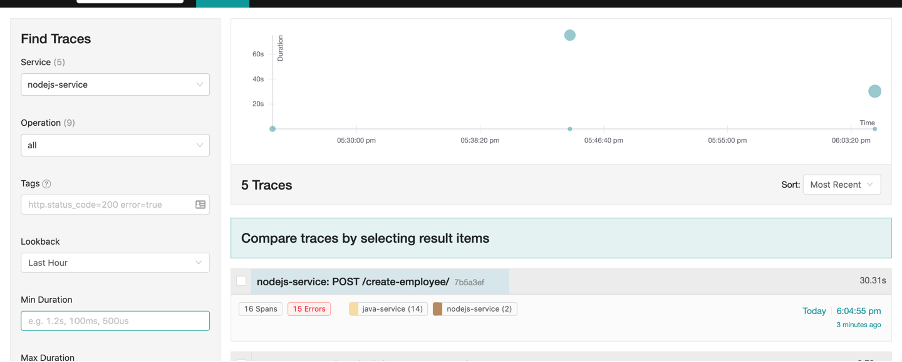
This is where the power of distributed tracing comes into play. If we refresh the Jaeger UI and click nodejs-service in the drop down and click Find Traces, now we have the following.
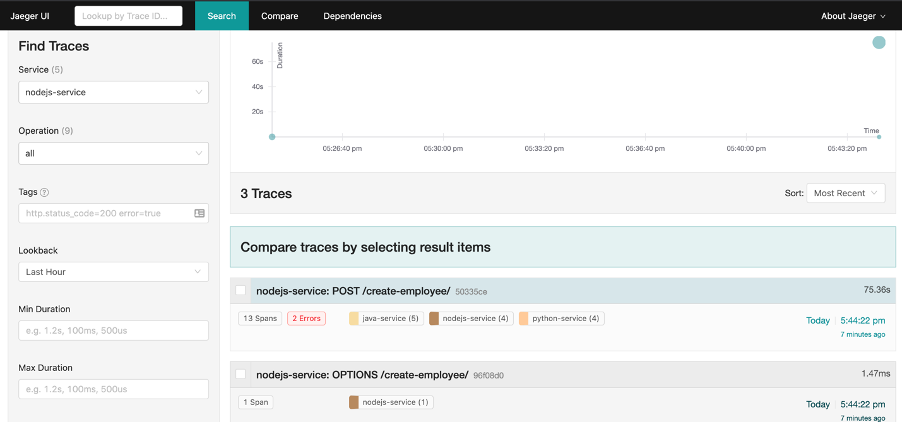
Technically, when someone files a bug, you would normally have some information about the screen they were on which allows you to narrow things down to the specific service. For us, we know that the problem happened on the front-end, but since we haven’t got the VueJS Jaeger exporter functionality currently, we go to the next service down in the stack that has got the functionality - the nodejs-service. This is why we selected the nodejs-service in the drop down and not the go-service - although that’s where the problem is (which you wouldn’t actually know in a real scenario).
Looking at the Jaeger UI we can see that there were 2 errors. Let’s click this trace to see more information.
We can see that at the bottom the nodejs-service POST /employee request failed. Let’s click this to see more information as we still don’t know why.
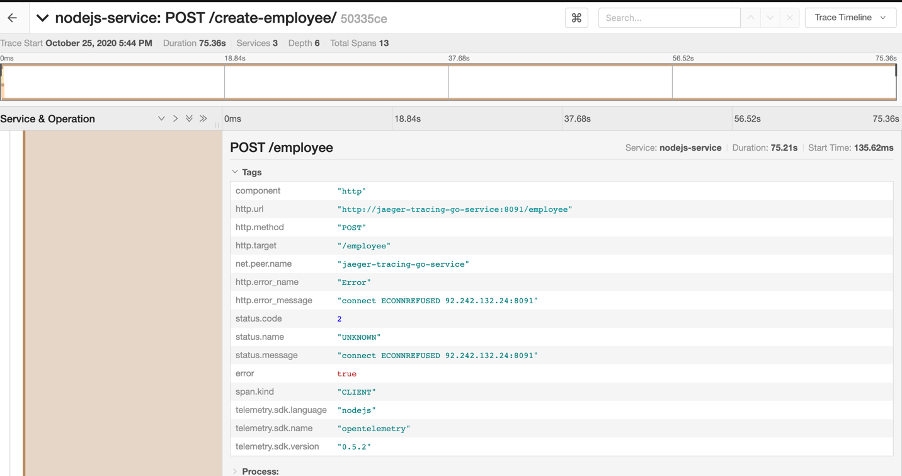
That’s more like it. We can see that the POST request http.url http://jaeger-tracing-go-service:8091/employee failed with an error saying ECONNREFUSED. With this information we’ve narrowed the problem area down to a specific service. Is the service down? Or is the URL we are sending the request to wrong? Due to the tracing data we now have, we can investigate further. As Martin Chalfie describes “the more one can see, the more one can investigate”.
This is the power of distributed tracing. Giving you the insights to the interactions between your systems components and domains. There are additional features in Jaeger that allows you to visualise the exported data in different ways. If you’re running my example system, feel free to have a play around.
My Database is Down?
Now, building on top of the above. Let’s say there is a problem with the database (but act like you don’t know it yet). If I stop the PostgreSQL database that the java-service uses and rerun the same create employee request on the front-end, what do we think will happen?
Well, when the error eventually gets thrown to the front-end, let’s refresh the Jaeger UI whilst clicking Find Traces on the nodejs-service.
Oh wow! There are now 15 errors? Let’s click the trace to find out more.
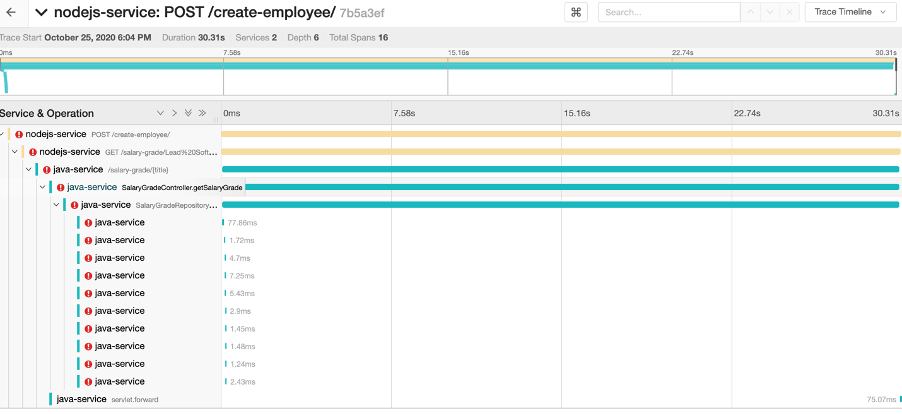
That’s a lot of errors coming from one service. But any experienced engineer could tell you that there is obviously some retry logic being used in the Java service (offered out of the box by Spring) and due to the problem still occurring after the 10th try, it eventually fails and reports back to the caller - which in this case is the nodejs-service.
Let’s click the first error entry for the java-service.
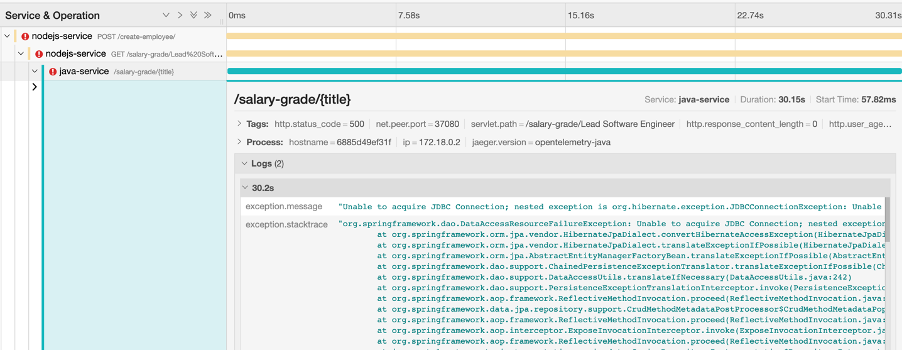
Interesting. We are getting a JDBC connection error. Any java engineers know that JDBC connection errors are database connection issues.
Let’s investigate further by clicking lower down in the java-service errors.
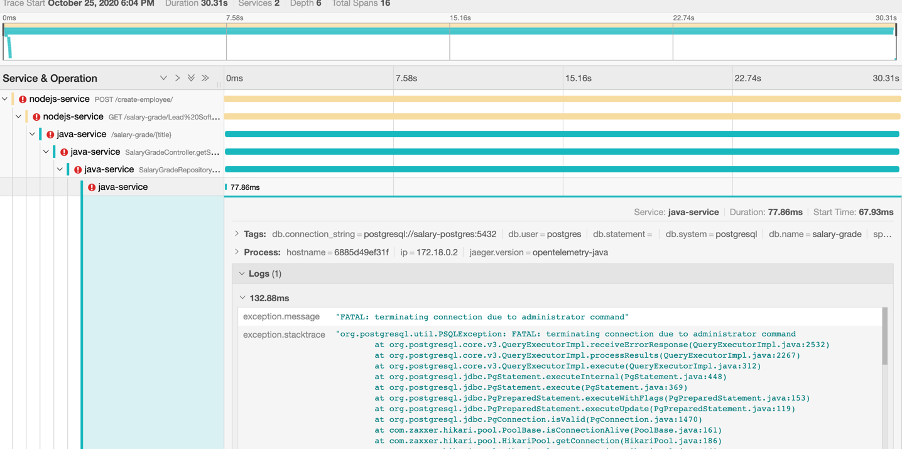
Bingo! Based on just the one panel being expanded, we can see from the java stack trace there was a connection issue whilst dealing with the PostgreSQL database. This now gives an engineer more information on where the problem area is and will swiftly lead to the discovery of the root cause.
Something I don’t want you to miss, is the Logs section. If, as part of your code, you are logging any output, it will be displayed in Jaeger as part of the data of the Span. Also, I hope you recognise that we can also see that the go-service and python-service spans are not in the trace. This is simply because the java-service is the first back-end service that the nodejs-service calls, so an error there means no calling of either the python-service or go-service.
Lastly, a quick observation from me and my experience of dealing with some of the languages for this demonstration, it seems that the Java auto-instrumentation libraries are far more comprehensive than the rest. However, due to the rapid feature additions and contributions made to OpenTelemetry monthly, big strides will be made in all other languages and their frameworks over the next few years.
Wrap Up
Although this was a very simple demo application, it’s easy to see the benefits of what distributed tracing brings. In fact, one thing I can say for certain, was when I was testing the front-end, and I wasn’t getting the response that I expected, it was actually much easier to just look into the Jaeger traces to find where the problem was occurring - as opposed to just looking at the docker-compose logs.
For very complicated systems and architectures, distributed tracing becomes pretty much invaluable. With the auto-instrumentation capabilities that come out the box with the most popular frameworks and languages make it incredibly easy to get up and running. It took me around about a full week of accumulated hours to get a very simple employee management system in a working state where I could use it for this post - that is for the different languages and frameworks. Normally for companies who only really have one or two main languages, it should be relatively easy to adopt and trial proof-of-concept work with OpenTelemetry & Jaeger/Zipkin. Depending on your architectural maturity and platform capabilities, you may be able to get a full working distributed tracing capability within your clusters - all thanks to the auto-instrumentation that is offered by OpenTelemetry. If, however, you have a bit more money and time to spend on developing an effective observability platform, you may even want to implement manual instrumentation that more effectively suits your business needs.
I hope you’ve learnt something in this post, if you have any questions, feel free to contact me on the socials. If you have any issues with the example employee management system, feel free to raise an issue on the GitHub repository and I’ll get back to you as soon as I can.