This post delves into Little’s Law and how it relates to KanBan for software development. Understanding these concepts and their relationship will help agile practitioners improve the delivery pipeline, in particular by knowing what to measure and inspect. (Software engineers will also spot the parallels with scaling a solution: capacity, response latency and throughput.)
Little’s Law
Little’s Law is often quoted in the context of KanBan. Little’s Law is a mathematical theory of probability in the context of queueing theory:
L = λW.
L = number in the system
λ = throughput
W = response time
In practical terms this means:
- response time can be calculated from number in the system and throughput (W = L/λ)
- number in the system can be calculated from throughput and response time (L = λW)
- throughput can be calculated from number in the system and response time (λ = L/W)
Steady State
The relationships described by Little’s Law only work in a steady state. Steady state is achieved when the arrival rate is the same as the departure rate on average over the long-term.
This means that throughput, arrival rate and departure rate are the same metric.
WIP
Guides to KanBan discussing Little’s Law will introduce the concept of WIP (work in process or work in progress), or more to the point, WIP limits. In order to maintain steady state, a WIP limit is defined before the bottleneck. This ensures the “system” (a particular step in the process) is protected from overload by limiting the arrival rate.
If we take a commonly-used example - a supermarket store - the throughput is the same as number of customers entering the store and is the same as the number of customers leaving the store. Minor disruptions to this flow are okay as Little’s Law holds over the long-term.
But what happens if too many customers enter the store? First, the number of customers in the store will increase. This will lead to a greater demand on the checkouts. More checkouts may need to be opened. Once the capacity of the checkouts is reached, the queues at the checkout will get longer. Eventually these queues will get long enough to fill the capacity of the store and block customers trying to enter the store. This may even block the exit to the store and so customers can no longer leave the store: chaos. Log jam. A broken system no longer in steady-state.
In other words, the arrival rate exceeded the departure rate and the throughput couldn’t be maintained: Little’s Law no longer held.
A WIP limit would have prevented the problem. A example WIP limit would be periodically closing the doors to restrict the number of customers entering the store.
Queue Time
Of course closing the doors only prevents the problem of blocking the entrance. Ultimately this would have led to another problem: queues outside the store or, worse still, turning customers away.
So what else could have been done? In the example the service rate was increased - more checkouts were opened - in an attempt to match the increased arrival rate. To enhance this option further even more checkouts could be installed. Perhaps the capacity of the store could be increased: building work to increase the size of the shop floor.
Queues are a form of waste within Lean. This is because queues are considered a form of inventory - potential value sitting on the shelf. In the example, customers waiting at the checkout are finished shopping (the trolley contains the potential value), the value will only be realised when they have paid for the goods. And of course, nobody likes queueing!
So a better approach might be to improve the efficiency of the checkouts - better training of staff or more efficient checkout systems.
Improvement
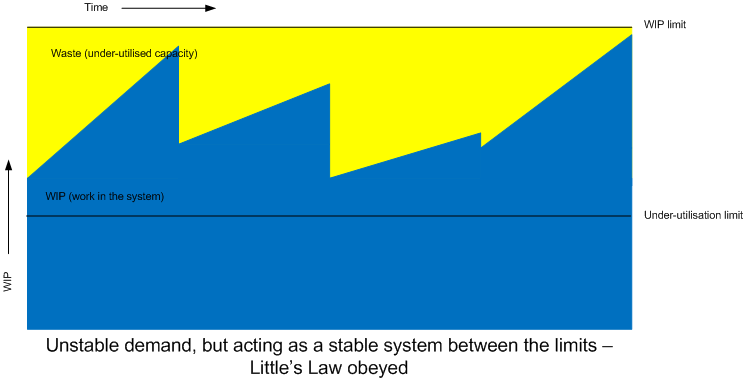
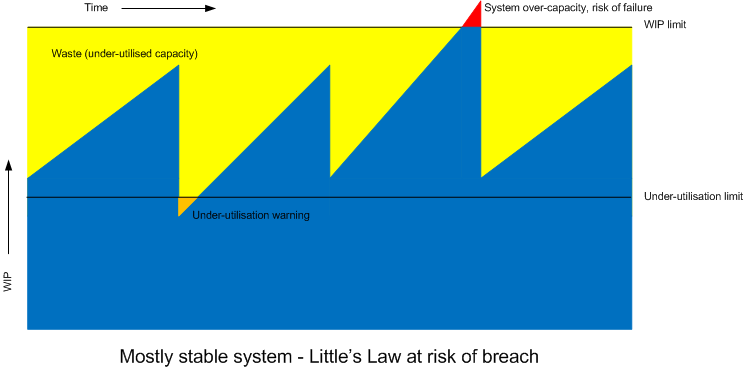
The mere presence of the WIP limit tells us there is a weakness in the system. Regularly hitting the WIP limit (or even breaching it) should tell us we have a problem that needs attention. Lean (or rather the Toyota Production System) might refer to this as an “Andon” - a warning lantern of some sort to indicate there is a problem.
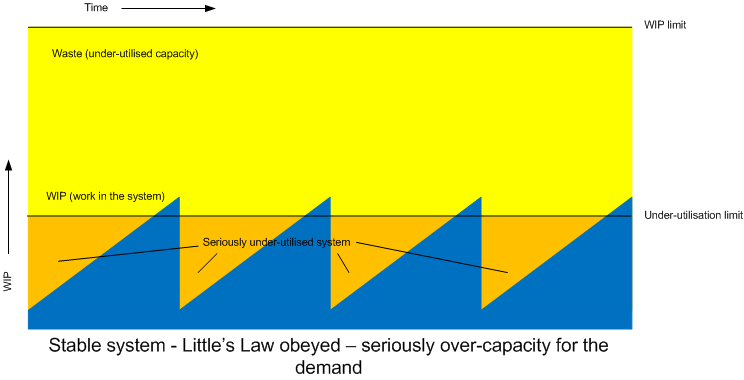
Conversely, never getting anywhere near the WIP limit might indicate our system is under-utilised, essentially another form of waste. To much resource has been allocated to the system to match the demand. Perhaps improvement work could be done to release this spare capacity and allocate it elsewhere.
Bottlenecks and Throughput
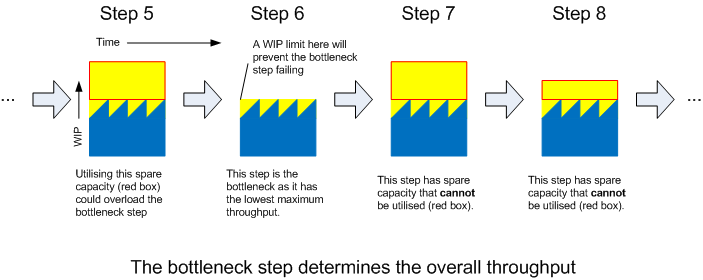
These constrained systems are often referred to as bottlenecks. However there is actually only one bottleneck step in a steady process. The bottleneck step is the step that determines the overall throughput, that is the throughput of the overall process is equal to the throughput of the bottleneck step - the step with the lowest throughput. This is because the upstream steps are feeding the bottleneck at a rate equal to or higher than it can handle; downstream steps are being fed at the rate of the bottleneck as so cannot achieve a higher throughput.
Addressing any other step in the overall process will have absolutely no effect whatsoever on the overall throughput. There is no point increasing the efficiency of any step other than the bottleneck step in trying to increase throughput.
KanBan and Software Development
One of the challenges software development faces is that the process is rarely steady state: it is notoriously difficult to estimate accurately and it’s unpredictable when problems will occur. The arrival rate into the process is often very variable - feast or famine. Add to that pressures to deliver rapidly and competing priorities it’s easy to see why software delivery is an unpredictable art rather than a nice predictable science.
So what can KanBan and Little’s Law offer to software development?
Firstly, we need to know what our process actually is. How often does the delivery pipeline get mapped out end to end? This is worth doing, even the steps outside our influence. Even if all this achieves is to visualise the process, this is a valuable in itself.
Then we can start to analyse the steps. Collecting metrics will help us do this. Referring to Little’s Law, for each step we need to know any two of:
- L = number in the system
- λ = throughput
- W = response time
…then the third can be calculated assuming a steady state. (On that basis it may be worth tracking overall throughput to check how steady the overall process is.)
High numbers in any of these for a particular step (compared to other steps in the process) will indicate a problem / potential bottleneck.
Assigning WIP limits to steps will also tell us how often desirable throughput rate is breached. If a low-WIP is set then this can also tell us if the step is under-utilised.
For over-utilised steps either make the step more efficient, assign more resource or increase the storage capacity within the step.
Since L is proportional to W, increasing the number in the system is a trade-off that will increase the response time. i.e. increase lead-time.
Achieving Steady State
Given that the demand is fluctuating, estimates are inaccurate at best and problems can occur any time, it is difficult to maintain a steady state. There are two ways to achieve this:
- Reduce the demand to a throughput level that will never breach any step in the process.
- Increase the throughput level of every step in the system to match the maximum demand.
The first option gives the ultimate control. The process is streamlined, there is little waste in the system. The cost is that throughput is decreased.
The second option gives the best performance. Any level of demand can be met. A good deal of redundancy has been introduced to the system to cope with a sharp increase in demand. The cost is that it may require a great deal of investment to achieve such a system and it may take a significant period of time to get there.
Of course reality is somewhere between the two. Rarely can we afford ultimate performance, but rarely can we constrain the system to a low-level of serviceable demand. The economic version of this is turning customers away - rarely good business sense.
Flexible System
A blockage of some sort is usually a pinch point in software development (e.g. a defect or a failed build). Ideally people will “swarm” to the problem - but this depends on availability of people to be able to swarm. If the system is overloaded people are not available - thus it’s better to build in some spare capacity to free people up should such a situation arise.
Out of software development, motorways are an example. When the system is running at full capacity, it only takes a minor disruption in flow to create a traffic jam. The incident may have been as simple as a driver changing lanes causing the car behind to apply the brakes. This causes other drivers to brake causing a disruption - chaos ensues. (See also traffic compression wave.)
Traffic management has improved with the relatively recent use of variable speed limits. This works in two ways: a slower speed limit is introduced (effectively a WIP limit) but also the hard shoulder is opened up as another traffic lane (capacity is increased). I’m not sure how this is achieved technically - I presume there’s some traffic control centre monitoring traffic flow and throughput - but it will be down to some measure of this metric, plus number in the system and response time. Perhaps if the number of cars passing junction 4 is greater than the number of cars passing junction 5 this indicates a problem between junction 4 and 5? Response: activate variable speed limit traffic control.
Closer to software development, elastic computing works in a similar way. Demand increases, more CPU is added. Demand decreases, CPU is taken away.
Could this be achievable in software development? Detect (or predict) an increase in demand, so increase the available resource? Maybe, it will depend on the lead-time to react. If by resources we mean people then it often takes a while to get more people in, familiarise them and re-establish the team (forming, storming, norming, performing; see also Brooke’s Law). If by resources we mean computing power (e.g. for an automated pipeline) then elastic computing is desirable - so long as it has been designed for.
Measure It!
Of course we cannot make any informed decisions if we don’t have the information. To get the information we need to measure things.
Recommendation is to: start at a high level and map the process end to end; measure enough to find out where the hot-spots are, then delve deeper into those steps.
Automated measurements are better than manual (rapid, repeatable, reliable). Automation is essential if used as an indication for immediate attention.
A high-threshold mark will tell us when the demand on the system is too high. A low-threshold mark will tell us when the demand on the system is too low. Plotting these measures on a time-line would be very useful for analysis - perhaps as input to a retrospective.
Simply providing the metrics may well be enough to grab attention.
About This Post
My motivation for creating this post was not to explain Little’s Law, rather to show how it relates to KanBan. I had struggled for some time relating the concepts as Little’s Law is all about steady state and software development is very rarely steady state. I had understood this related to WIP and WIP limits, but had not appreciated how.
In this post I believe I’ve also introduced a new concept, that of the low-utilisation threshold. Tracking such indicators over time could be very useful for elimination of waste or re-deployment of resources.
